

Using Dashboard › Dashboard Reports › Deduplication Status Report › Deduplication Status Report- Report View
Deduplication Status Report- Report View
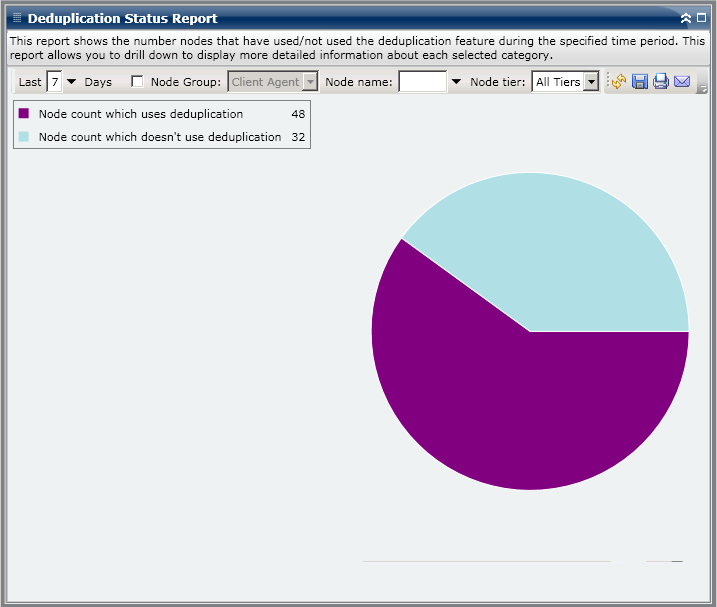
The Deduplication Status Report is displayed in a pie chart format, showing the number (and percentage) of nodes that benefited from deduplication and the number of nodes that did not. This report contains filters for Last # Days, Node Group, Node Name, and Node Tier.
- Node count which benefited from deduplication is defined as the number of nodes that have one or more sessions which used a deduplication device, and the calculated compressed backup size is less than the raw backup size.
- Node count which did not benefit from deduplication is defined as the number of nodes that have one or more sessions which used a deduplication device, and the calculated compressed backup size is not less than the raw backup size.
More information:
Deduplication Status Report
Deduplication Status Report- Report Benefits
Deduplication Status Report- Drill Down Reports
Copyright © 2017 .
All rights reserved.
|
|