

Using Dashboard › Dashboard Reports › Node Tiers Report › Node Tiers Report- Report View
Node Tiers Report- Report View
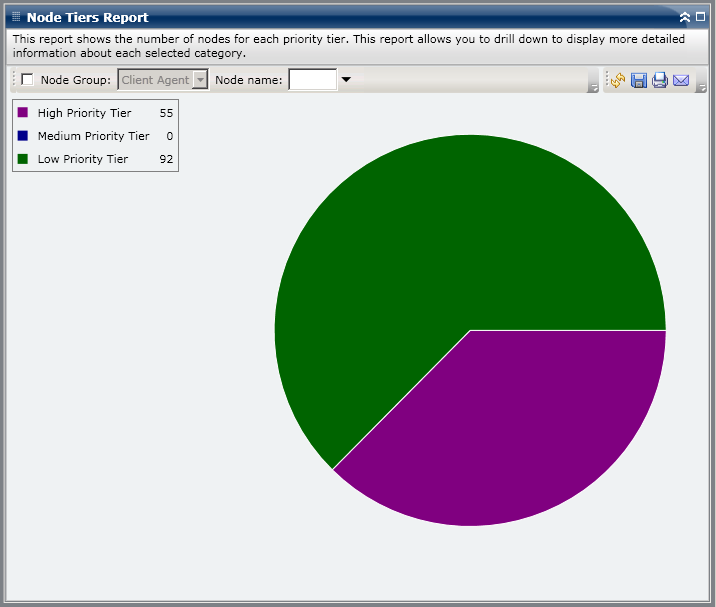
The Node Tiers Report is displayed in a pie chart format, showing the node count for each priority tier. This report contains filters for Node Group and Node Name.
More information:
Node Tiers Report
Node Tiers Report- Report Benefits
Node Tiers Report- Drill Down Reports
Copyright © 2017 .
All rights reserved.
|
|