

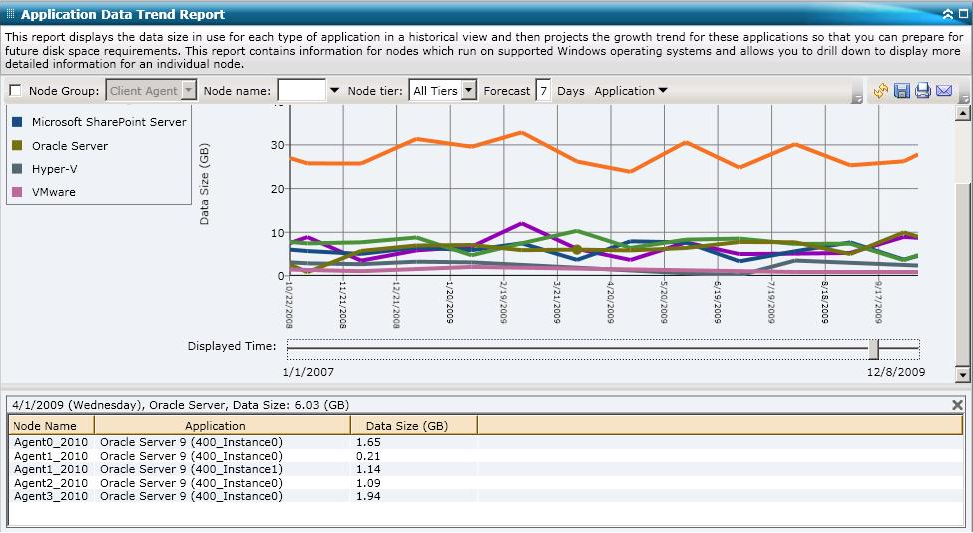
The Application Data Trend Report is displayed in graph format showing the amount of data in use (in GB) for each particular application, along with the anticipated trends during a future time period. The report lets you specify the view mode (Week, Month, Year, All, and Customized Time Range) for the displayed time period. You can use the scroll bar at the bottom of the chart to adjust the time period being displayed or click on any sample point along the data line to display more details about that specific sample point. You can also filter the data by individual applications and the forecasted time range.
This report lets you easily see the projected trends in storage capacity for the applications to help you plan for your future data storage needs. The data from each application is displayed as a separate line with a separate color and the projected data for that application is displayed in a lighter color. A summary line chart is also available to display the overall data size (and trend) for all selected applications. Only data from installed applications (protected by Arcserve Backup) will be displayed.
Note: To ensure that you are reporting the correct database size of an Oracle database, the Oracle instance should in the archive mode.
The Application Data Trend Report can be further expanded to display more detailed information. You can click on a sample point on the line chart to show the details of that time period. This drill-down report includes the node names, along with the associated application types and data size (in GB) for each listed application.
This report contains filters for Node Group, Node Name, Node Tier, Forecast, and Application.
|
Copyright © 2017
|
|