

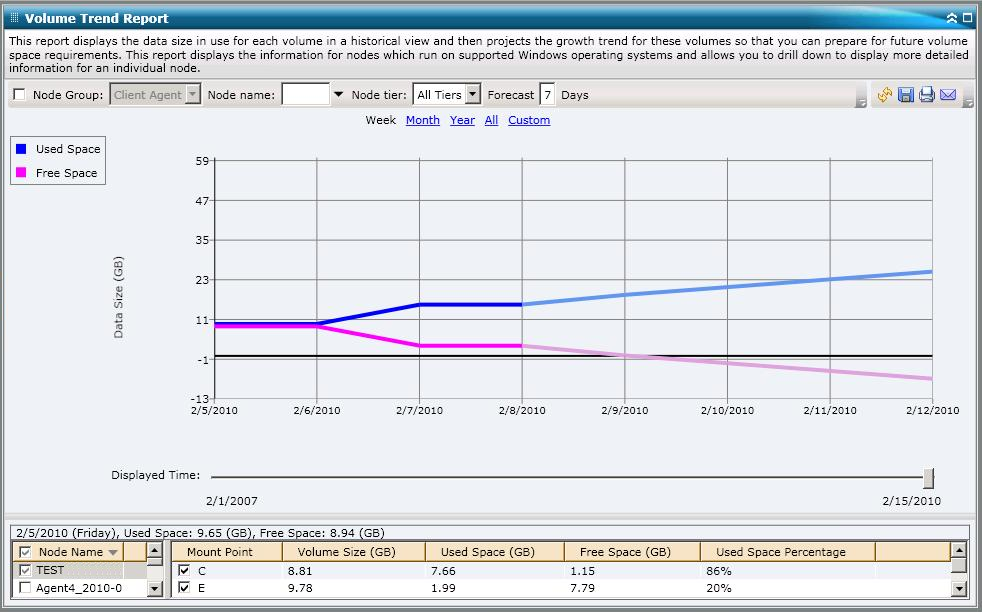
The Volume Trend Report is displayed in graph format showing the used space and free space capacity (in GB) for each volume, along with the anticipated trends during a future time period. The report lets you specify the view mode (Week, Month, Year, All, and Customized Time Range) for the displayed time period. You can use the scroll bar at the bottom of the chart to adjust the time period being displayed or click on any sample point along the data line to display more details about that specific sample point. This report contains filters for Node Group, Node Name, and Node Tier. You can also filter the data by individual volumes and the forecasted time range.
This report lets you easily see the projected trends in capacity for each volume to help you plan for your future needs. The data from each volume category (Used Space and Free Space) is displayed as a separate line with a separate color and the projected data for that volume category is displayed in a lighter color.
The Volume Trend Report can be further expanded to display more detailed information. You can click on a sample point along the line chart to show the details of that time period. This drill-down report includes the node names, along with the associated mounting points, volume size, used space, free space, and used space percentage. You can also select different volume combinations to display their accumulated size trends.
|
Copyright © 2017
|
|