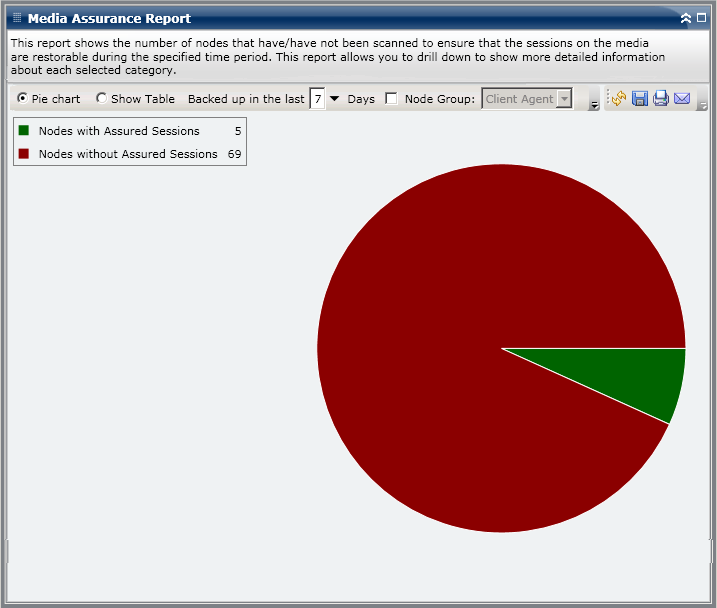

The Media Assurance Report can be displayed as either a pie chart or as a table. This report contains filters for Last # Days, Node Group, Node Name, and Node Tier.
Note: The date range filter for this report applies to the number of days since the last backup was performed, and not the number of days since the last media scan was performed.
Pie Chart
The pie chart shows the distribution of nodes (number and percentage) that have/have not been scanned to ensure that the sessions on the media are restorable for all days during the last specified number of days.

Show Table
If you select Show Table, the Media Assurance Report displays more detailed information in table format listing the Node Name, along with corresponding information about the backups, scan sessions, and media.
Note: You can select the node name and right-click the mouse button to display a pop-up window with all related node information for the selected node. For more information, see Node Information.
|
Copyright © 2016 |
|