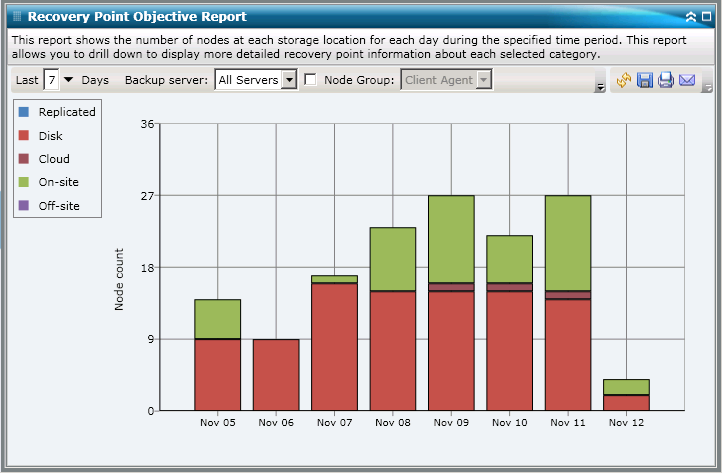

The Recovery Point Objective Report is displayed in a bar chart format, showing the number of nodes that were backed up to the various recovery point locations during the specified time period. The bar chart provides a detailed level view of the nodes that were backed up for the selected server during each day of the time period. The status categories shown in the bar chart represent the daily number of nodes backed up at each recovery location (replicated, disk, cloud, tape on-site, and tape off-site). This report contains filters for Last # Days, Backup Server, Node Group, Node Name, and Node Tier.

|
Copyright © 2016 |
|