

The Dashboard screen is accessed from the Navigation bar on the left panel of the CA ARCserve Central Reporting application. You can view details of your protected environment in a single central view of status roll-ups and summary reports. With each of the reports you can expand and drill down into specific computers, which can help you determine the root causes of problems.
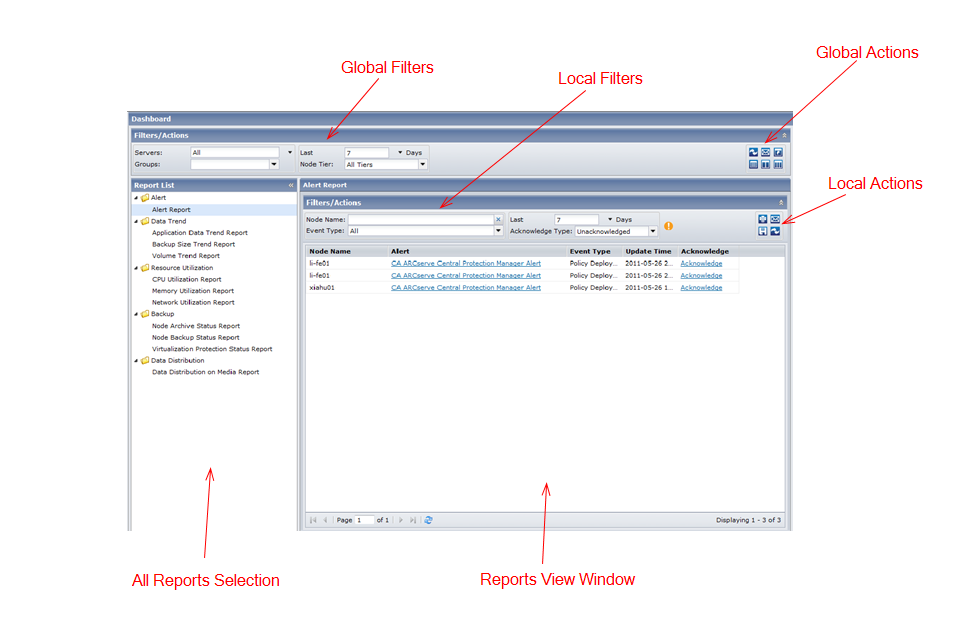
The Dashboard screen lets you filter your reports in two perspectives: Global and Local.
The Groups filter displays application types and names of CA ARCserve Backup and CA ARCserve Central Protection Manager default and custom groups. This selection is applied to all reports listed in the Report List.
The Last Days field contains a drop-down menu with a preset listing of the most commonly used data collection time periods (1, 3, 7 (default), and 30 days) to select from. You can also manually enter a value in this field.
Specifies the tier category for the nodes you want to monitor. This filters all reports based upon the selected node tier that you want to monitor.
The node tiers are configured into three categories: High Priority, Medium Priority, and Low Priority.
Note: The Node Tier for CA ARCserve D2D nodes is Medium Priority.
Note: All reporting data is obtained from CA ARCserve Central Protection Manager where each node is registered and synchronized. For more details, see section on 'What You Can Do With Nodes' in the CA ARCserve Central Protection Manager User Guide.
|
Copyright © 2013 CA.
All rights reserved.
|
|