Using CA ARCserve Central Reporting › CA ARCserve Central Reporting Types › Backup Reports › Virtualization Protection Status Report › Virtualization Protection Status Report View
Virtualization Protection Status Report View
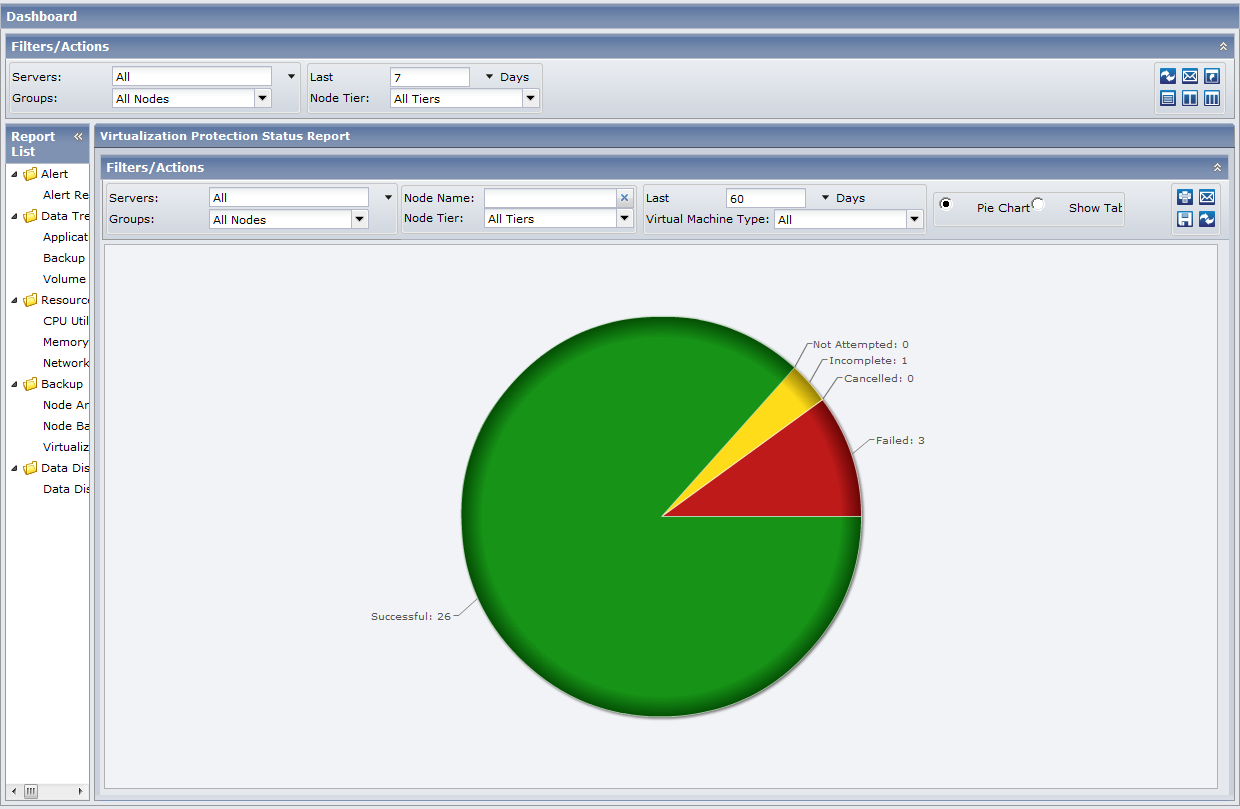
The Virtualization Protection Status Report is displayed in a pie chart where you can drill into to view more details on virtual machine statuses.
This report contains the following filters:
- Servers--Specifies All or specific nodes added from CA ARCserve Central Protection Manager.
- Groups--Specifies All or specific application types and names of the CA ARCserve Backup and CA ARCserve Central Protection Manager default and custom groups.
- Node Name--Indicates the name of the agent node or the member server for CA ARCserve Backup or the name of the CA ARCserve D2D node.
- For power-on virtual machines protected by CA ARCserve Central Host-Based VM Backup, this field displays the host name of the virtual machine in the report results.
- For power-off virtual machines protected by CA ARCserve Central Host-Based VM Backup, this field displays 'Unknown (virtual machine name)' in the report results.
Note: You cannot filter this report by searching for the word 'Unknown', however, to search for 'Unknown' Node Names, leave the Node Name filter blank to return all Node Name results or power-on the virtual machine to be detected.
- Node Tier--Specifies the tier category for the nodes you want to monitor. This will filter all reports based upon the selected node tier.
The Node tier field contains a drop-down menu listing each tier category to select from: High Priority, Medium Priority, and Low Priority.
Note: The tier for CA ARCserve D2D nodes is Medium Priority.
- Last (number of) Days--Specifies a preset listing of the most commonly used data collection time periods (1, 3, 7 (default), and 30 days) to select from. You can also manually enter a value in this field.
- Virtual Machine Type--Specifies the type of virtual machine for the node you want to see the most recent backup status for.
The pie chart is divided into a series of sectors: Successful, Incomplete, Failed, Cancelled, and Not Attempted. Each sector represents a percentage of the particular virtual machine being monitored. For more details on each sector, see Virtualization Protection Status Drill Down Report.
|
Copyright © 2012 CA.
All rights reserved.
|
|

