

The Disk Report is displayed in a pie chart format or table format. This report contains filters for Node Group, Node Name, and Node Tier.
Pie Chart
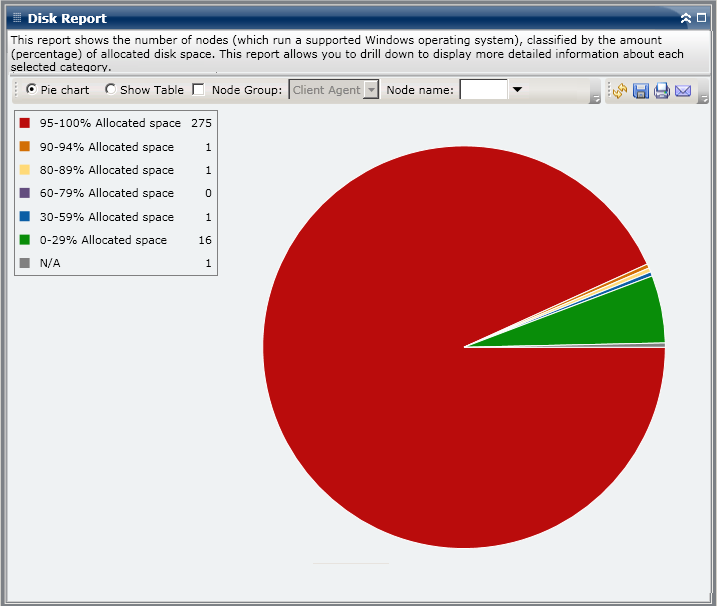
The pie chart provides a high-level overview of the disks in your environment, sorted by pre-configured used disk space ranges (in percentage). You want to make sure that your disks are allocated properly because if space is not allocated, then it cannot be used.
Show Table
If you select Show Table, the Disk Report displays more detailed information in table format, listing the Node Name, OS, Disk Name, Manufacturer, Type, Size, Used Space, Unused Space, Number of Volumes and Volume Names for all of the allocated space categories.
Note: You can select the node name and right-click the mouse button to display a pop-up window with all related node information for the selected node. For more information, see Node Information.
|
Copyright © 2017
|
|