Previous Topic: Monitor CA ARCserve D2D AlarmsNext Topic: Run the D2D Commands Using the Nimsoft Probe Utility


Configure the D2D Node Status Report

The D2D Node status report shows the status of last backups, number of available recovery points, and operating systems on each D2D node. You view this report from the Nimsoft UMP. To add this report to the Nimsoft UMP, you must import the D2D node status.xml file. This file is part of the D2D probe zip file that you previously downloaded from the CA ARCserve D2D website.

Follow these steps:

  1. Log in to the Nimsoft Unified Management Portal (UMP) as an Administrator.

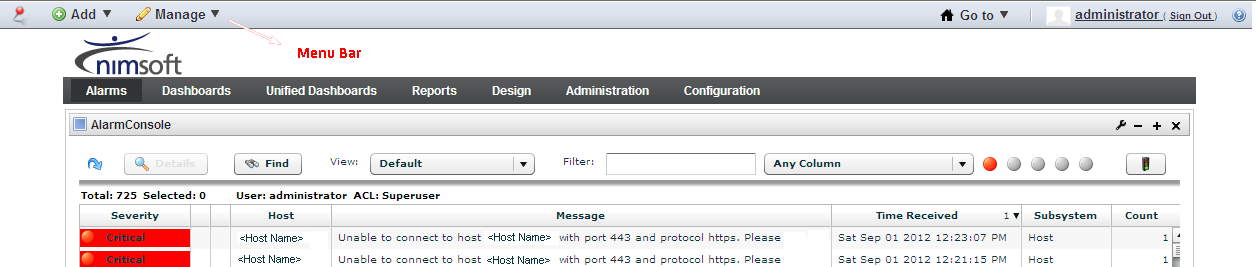
    The UMP interface is displayed.

    UMP_main_page

  2. From the top menu, click Design and select Lists.

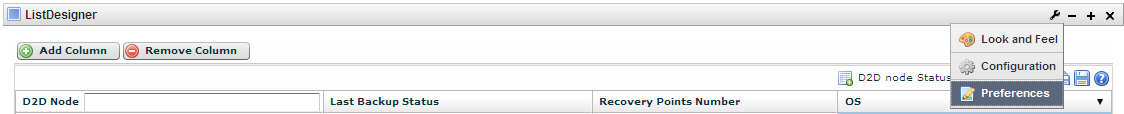
    The List Designer page opens.

  3. From the top right side of the page, click the Open View icon.

    The Open View dialog opens.

  4. Click Import and select the D2D node status.xml file.

    Note: The D2D node status.xml file is downloaded with the D2D probe package. You can locate the file in the folder where you saved the downloaded zip file.

    The node status report is displayed on the List Designer page.

  5. Click the Save View As icon to save the report with a descriptive name such as D2D Node Status.
  6. From the Menu bar, click Add and select Page to add a new tab for the status report.

    A new text box is displayed to the right of the last tab.

  7. In the text box on the new tab, enter a title for the D2D node status report and click the check icon.

    The title is added to the new tab. For example, assume you entered "D2D Reports" then that would be the title for the new tab.

  8. From the Menu bar, click Manage, and select Page to add subtabs to the D2D Reports page.

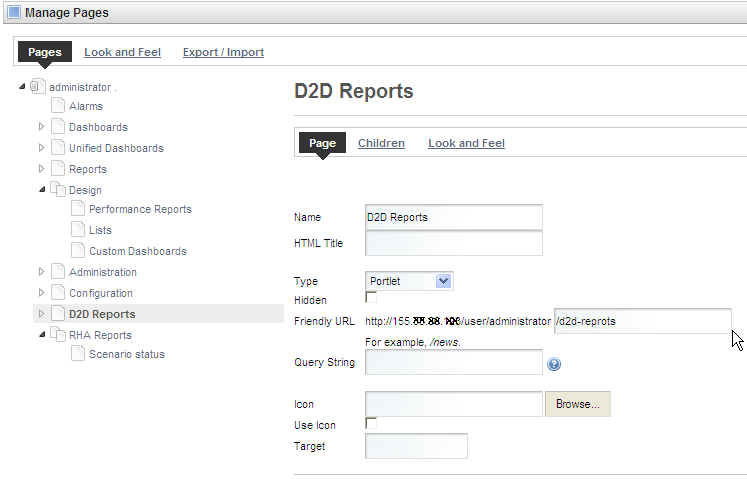
    The Manage Pages page opens.

  9. Click the Pages tab and select D2D Reports.

    The D2D Reports page opens.

    manage_pages_ump

  10. Click Children, and select New Page to enter a name for the new subtab.

    The title is added to the new subtab. For example, assume you entered "Node Status" then that would be the title for the new subtab.

  11. Click Add Page to save the new subtab.
  12. Click Return to Full Page to open the List Viewer page.
  13. Click D2D Reports, and select Node Status on the top bar to open the Node Status page.
  14. Click the Wrench icon, and select Preferences.

    A list of reports is displayed.

    preferences

  15. Select the D2D Node Status report and click Save.
  16. Click Return to Full Page to display the List Viewer page.

The D2D Node Status report is configured. You can now quickly view the D2D Node Status report when you click D2D Reports and select Node Status.