

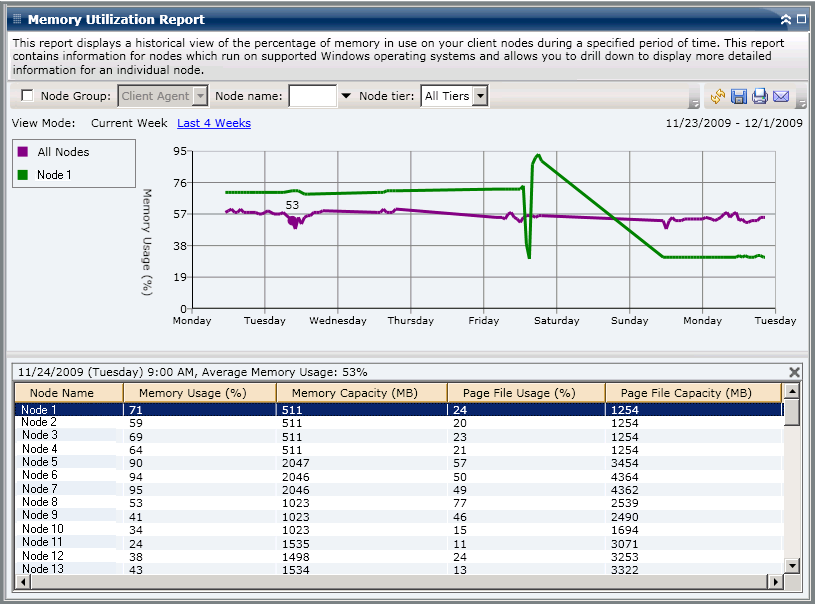
The Memory Utilization Report is displayed in graph format showing a historical view of the percentage of memory usage for the monitored servers during a specified time period (only for nodes which run a supported Windows operating system). The report lets you specify the view mode (Current Week or Last 4 Weeks) for the displayed time period. The Current Week mode displays data for the last 7 days, and the Last 4 Weeks mode displays data for the last 4 weeks. You can use the scroll bar at the bottom of the chart to adjust the time period or click on any sample point along the data line to display more details about that specific sample point. You can also filter the data by node name, node group, or node tier level.
The Memory Utilization Report can be further expanded to display more detailed information. You can click on a sample point on the line chart to show the details of that specific time period. This drill-down report includes the Arcserve Backup protected node names, along with the corresponding percentage of memory usage, memory capacity, page file usage, and page file capacity for each node. You can also click on the name of an individual node to display the line chart information for that particular node overlaid on the overall line chart.
Note: A page file is a reserved portion of the hard disk drive that is used to temporarily store segments of data. This data is then swapped in and out of your physical memory when there is not enough memory to hold all that the applications are calling for and frees up some physical memory for your applications. A page file can also be referred to as a swap file.
|
Copyright © 2017
|
|