

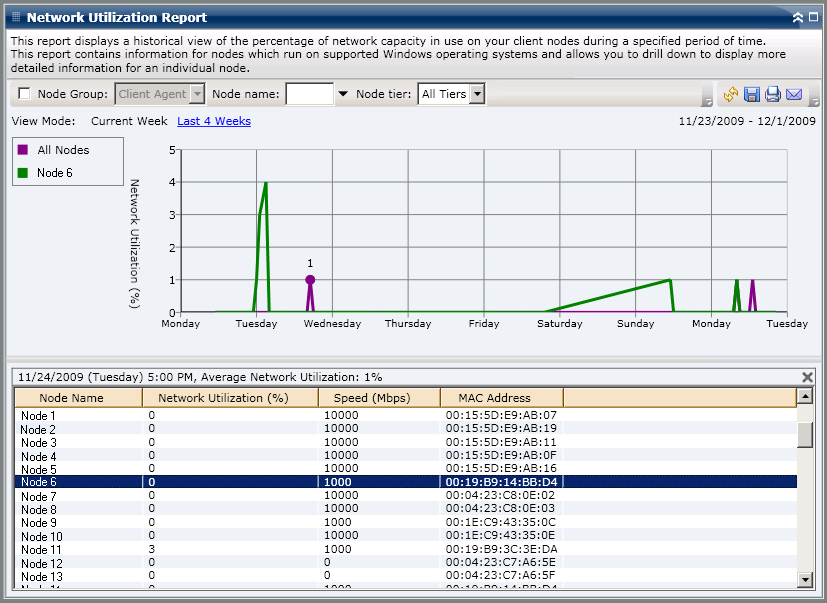
The Network Utilization Report is displayed in graph format showing a historical view of the percentage of network (NIC) usage for the monitored servers during a specified time period (only for nodes which run a supported Windows operating system). The report lets you specify the view mode (Current Week or Last 4 Weeks) for the displayed time period. The Current Week mode displays data for the last 7 days, and the Last 4 Weeks mode displays data for the last 4 weeks. You can use the scroll bar at the bottom of the chart to adjust the time period or click on any sample point along the data line to display more details about that specific sample point. You can also filter the data by node name, node group, or node tier level.
The Network Utilization Report can be further expanded to display more detailed information. You can click on a sample point on the line chart to show the details of that specific time period. This drill-down report includes the Arcserve Backup protected node names, along with the corresponding percentage of network usage, bandwidth speed (in MB/second), and the MAC address for each node. You can also click on the name of an individual node to display the line chart information for that particular node overlaid on the overall line chart.
Note: The MAC (Media Access Control) address is a hardware-unique value assigned by the manufacturer and associated with network adapters or network interface cards (NICs) for identification purposes.
|
Copyright © 2017
|
|