

The Log Messages screen is accessed from the Tasks section of the Central Manager left pane. The Log Messages screen displays log message information for the registered branch sites.
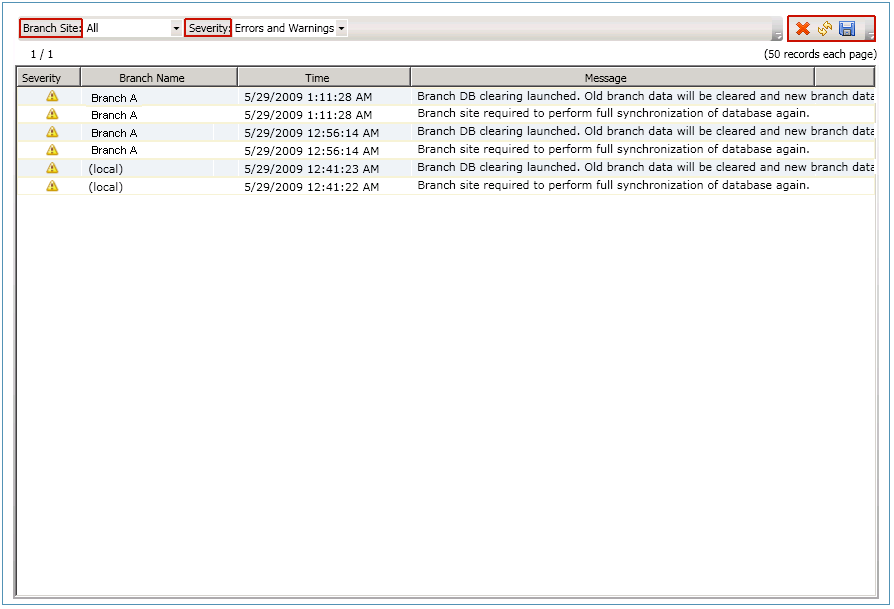
This listing can display log messages for all registered branch sites or can be filtered for just a specific branch site. This listing can also be filtered to display only messages for a specific severity level (All, Messages, Warnings, Errors, and Errors and Warnings).
You can click on any of the Log Messages column headings to sort the displayed information by the selected column.
Indicates the severity level of the displayed log message. The available levels are Error, Warning, or Message. The default setting is Errors and Warnings.
Indicates the name of the Branch Primary Server that recorded the log message.
Note: Local indicates the dashboard-related data is for the local server. If your server is configured as the Central Primary Server, the self-contained data for this server is treated the same as a separate Branch Primary Server and reported to the Global Dashboard as the "local" server.
Indicates the date and time that the log message was recorded. The date and time information is based on the local time for the Central Primary Server (and not necessarily the local time at the branch site).
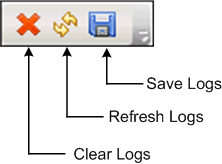
The Log Messages screen also includes icons to clear all log entries, refresh the log display, and save the logs.
|
Copyright © 2017
|
|