

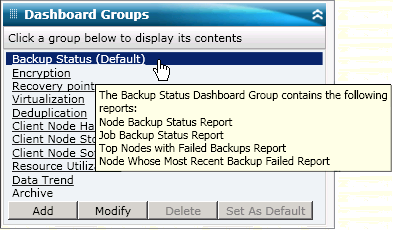
A Dashboard Group is a customized collection of reports that when selected displays the specified reports as a pre-configured grouping. Dashboard Groups let you organize the display of reports based upon your specific needs or preferences. Dashboard Groups help you focus on the status within specific areas of your environment. You can display the reports contained within a Dashboard Group by clicking the group name. In addition, when you hover the mouse cursor over a particular group name, a tool tip box appears under the cursor displaying the name of the group and a list of the reports contained within that group.
Arcserve Backup Dashboard lets you create, modify, and delete Dashboard Groups. When you add a new group, the created group is accessible for use only by that user. If you create a new group, it is not visible to other users. For example, if user A creates a group, user B will not see that group.
Arcserve Backup Dashboard contains several pre-configured groups, which if necessary can be modified, but not deleted. In addition to the pre-configured groups, you can also create your own customized Dashboard Groups, selecting the individual reports that are displayed in the group. Each Dashboard Group must contain at least one report and a maximum of four reports.
You can also specify which Dashboard Group will be the default group by selecting the group and clicking the Set As Default button. (Default) will be displayed next to the group name to indicate the current default group. Each time you access Arcserve Backup Dashboard, it will open with the default Dashboard Group displayed.
The pre-configured Dashboard Groups are as follows:
Contains the following reports: Node Backup Status Report, Job Backup Status Report, Top Nodes with Failed Backups Report, and Nodes Whose Most Recent Backup Failed Report.
Contains the following reports: Node Encryption Status Report and Tape Encryption Status Report.
Contains the following reports: Node Recovery Points Report, Virtual Machine Recovery Points Report, Recovery Point Objective Report, and Media Assurance Report.
Contains the following reports: Virtual Machine Recovery Points Report and Virtualization Most Recent Backup Status Report.
Contains the following reports: Deduplication Status Report and Data Distribution on Media Report.
Contains the following reports: Network Report, CPU Report, Memory Report, and SCSI/Fiber Card Report.
Contains the following reports: Volume Report and Disk Report.
Contains the following reports: Node Tiers Report, Agent Distribution Report, Node Summary Report, and License Report.
Contains the following reports: CPU Utilization Report, Disk Performance Report, Memory Utilization Report, and Network Utilization Report.
Contains the following reports: Application Data Trend Report and Volume Trend Report.
Contains the following reports: Job Archive Status Report, Node Archive Status Report, and Total Archive Size Report.
|
Copyright © 2017
|
|