

Arcserve Backup Dashboard provides a global options toolbar to let you apply specified actions to all reports. These specified actions have a global effect, and are applied to all reports as applicable. For example, if a global option is applicable to a report, then the action is applied to that report. However, if a global option is not applicable to a report, then the action is considered not relevant and has no effect on that report.

Specifies the Dashboard Mode to be displayed.
Note: For all Dashboard reports, when you access a report using the Global View option, an additional filter is available to let you limit the data displayed by specifying the Branch name (or selecting the Branch name from the drop-down menu). In addition, all table format reports will be expanded to include an additional column to list the Branch Name.
You can specify to filter the displayed data that is included in all reports based upon the last number of days. The Last Days field contains a drop-down menu with a preset listing of the most commonly used data collection time periods (1, 3, 7, and 30 days) to select from. You can also manually enter a value in this field.
Default: 7 days
You can specify to filter the displayed data that is included in all reports based upon the Node Group.
Each dashboard report that contains a Node Name filter also has the capability to include a Node Group filter. The Node Group filter is only displayed on a report if a Node Group already exists. If a Node Group exists, the group name will be displayed in the Node Group filter drop-down menu and lets you specify how to filter the information being displayed on that report. This selection will only be applied to the corresponding dashboard report and allows you to further filter the displayed information by a specific node within the specified node group.
For Global Dashboard, if you select the Global View and also select multiple branches to monitor, only the Node Groups which exist in all the selected branches will be displayed in the Node Group drop-down menu.
For example, if you have a Branch Group which has three branch sites (Branch 1, Branch 2, and Branch 3) and within each branch site you have the following Node Groups.
When you select this Branch Group in the Branch filter, only Group B will be displayed in the Node Group filter because this is the only Node Group that exists in all selected branches.
Note: Node Groups (or Server Groups) are created in Arcserve Backup from the Backup Manager (or from the Job Status Manager). For more information about creating Node Groups, see the Administration Guide.
You can specify to filter the displayed data that is included in all reports based upon the name of the node you want to monitor.
The wildcard characters asterisk and question mark are supported in the Node name field. If you do not know the complete node name, you can simplify the results of the filter by specifying a wildcard character in the Node name field.
The following Dashboard limitations apply to the Node name:
Note: You can select the node name and right-click the mouse button to display a pop-up window with all related node information for the selected node. For more information, see Node Information.
Specifies the tier category for the nodes you want to monitor. This will be filter all reports based upon the selected node tier that you want to monitor.
The node tiers are configured into three categories: High Priority, Medium Priority, and Low Priority. The Node tier field contains a drop-down menu listing each tier category to select from.
For more information, see Node Tiers.
Default: All Tiers
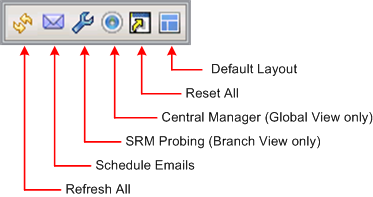
Refreshes all reports to display the most current data.
Specifies the email configuration settings for exporting Dashboard reports.
The email scheduling option lets you create a schedule to send reports via email to specified recipient(s). These report emails are automatically updated, generated, and sent as scheduled. You can customize the schedule of these report emails to be sent at specified days and times, as a recurring task. You can also specify which report(s) is included in the email and who these reports are sent to. The selected reports are embedded within the email.
For more information, see Configure Email Reports.
This option is only available when you select the Branch View mode.
Lets you initiate an immediate probe or configure the settings for scheduled probes to collect SRM-related data for the SRM-type reports. The SRM prober is a data-collection utility that when invoked, probes or communicates with all machines in your storage environment. These machines send back an updated response containing all related information to be included in the SRM-type reports.
For more information, see SRM Prober Settings.
This option is only available when you select the Global View mode.
Lets you access the Central Manager. The Central Manager provides a snapshot overview of your entire Global Dashboard environment. This user interface lets you quickly and easily monitor the status of any or all registered branch sites from a single location.
For more information, see Understanding Central Manager.
Resets all reports to the applicable parameter default values:
For all applicable reports, the default view is set to the Pie Chart view. If any reports have other parameters, they are set to default values.
Resets the overall layout of the reports to the default look. This option is useful when you are viewing multiple reports inside a Dashboard Group.
|
Copyright © 2017
|
|